
One of the bigger ideas and responsibilities in management is quality. In particular, the use of tools for defining, measuring, improving and controlling quality. Why are we covering quality here? Primarily because quality assurance is the highest form customer service, which is the ultimate responsibility of a manager. For those in the back that might have misheard, quality assurance is customer service. The importance of quality has been summed up nicely by Dr. W. Deming in what is called, “The Deming Chain” and can be seen below in image 1. His argument being that improving quality will lead to providing more jobs (and more money along the way).

Quality is a squishy concept to define, often subject to an individual’s opinions. What is or is not considered “quality” will vary between industries, but the following dimensions are used for most physical products. Brought to life by David Garvin in an article published by the Harvard Business Review in 1987, the eight dimensions of quality are;
- Performance – does the item do what it’s supposed to do
- Features – additional attributes to the basic functioning
- Reliability – the likelihood the product will not fail in a certain time period
- Conformance – how closely the product meets design and operating standards
- Durability – expected life of the product
- Serviceability – ease of repair if there is an issue
- Aesthetics – look, feel, sounds, taste. A subjective dimension that relies heavily on users
- Perceived Quality – reputation, or context surrounding the product (think Ford vs Mercedes – which is perceived to be higher quality?)
When discussing the quality of the product or service your business provides, the most important metric to know intimately is the cost of poor quality (COPQ). Specifically, what happens when a part needs to be remanufactured, a customer is lost, the brand is damaged due to poor quality, or what other consequences may result from failing to meet customer expectations? Questions like those need to be considered because there can be irreparable damage from quality issues. A poorly made meal that causes food poisoning, a cell phone battery that explodes, a wooden tchotchke that leaves slivers – issues like these can cause customers physical harm or cause perception of your business to plummet to the point you cannot gain new business. The above eight dimensions of quality are most often used to measure the quality of physical products as opposed to a service. Physical products have a distinct advantage for determining quality over services – namely there is something to hold, feel, and inspect. Nevertheless, there are countless service industries out there that can and want to improve their level of quality and as such need their own set of tools.
Measuring quality in a service industry relies on a set of considerations known as SERVQUAL (Service quality). The criteria were developed by A. Parasuraman et al. in the 1980’s and refined in the early 1990’s. The five criteria commonly used to gauge SERVQUAL are;
- Tangibles – the appearance of buildings, equipment, people, etc.
- Reliability – ability to deliver the expected service dependably
- Responsiveness – willingness and ability to provide prompt service
- Assurance – degree to which the provider installs trust and confidence
- Empathy – how well the provider pays attention to and cares for the customer
Focusing on the above metrics will generally bring better results, but may not always be enough. Quality will always be defined in the eyes of the customer. Like anything undergoing “improvement,” there needs to be a measurement and the measurement needs to be accurate. The tools used to collect quality data points need to be reliable and the people taking the measurements need to be able to repeat the measurements. Operators need to be consistent in their work when gathering the data. For example, if ACME Corp wants to improve their responsiveness, the time it takes to respond to a customer inquiry could be the metric. Measurement could be taken by looking at the time of a reply, compared to the time of the request. Once it is understood how long a response takes on average, work can begin on reducing wait time for customers.
In many large industries, the quality standard that gets measured is defects per million opportunities (DPMO). Those specific number stems from Six Sigma, a methodology built for quality that aims to reduce defects to 3.4 per one million opportunities (based on being within + or – three sigmas, a separation from the mean). In small businesses where there are not a million opportunities to measure, it’s common to see a half-assed attempt at measuring quality; an attempt where there is no specified acceptable defect rate.
Let’s say ACME manufactures and sells custom guitars. For each guitar they sell, the customer lets them know if they are “very satisfied,” “somewhat satisfied,” or “not satisfied.” If ACME considers customers that are very satisfied to represent a quality guitar and the other two positions to represent a defect, then they can use the percentage of very satisfied replies as a proxy for their quality level. We can say the number of very satisfied customers (VS) divided by total number of customers (TC) multiplied by 100 is the quality percentage.
Quality percentage = (VS/ TC) * 100
So, if ACME sold 750 guitars last month, with 680 customers being “very satisfied”, then,
(680/ 750) * 100 = 90.67%.
(not quite the 99.9996% Six Sigma aims for)
In ACME’s case, there is room to improve if using Six Sigma as a goal. If the company’s goal is a quality rating of 85%, ACME is doing pretty well! Most likely, though, that isn’t the goal. Most businesses aim for much closer to 100% on the quality scale. So what does ACME do?
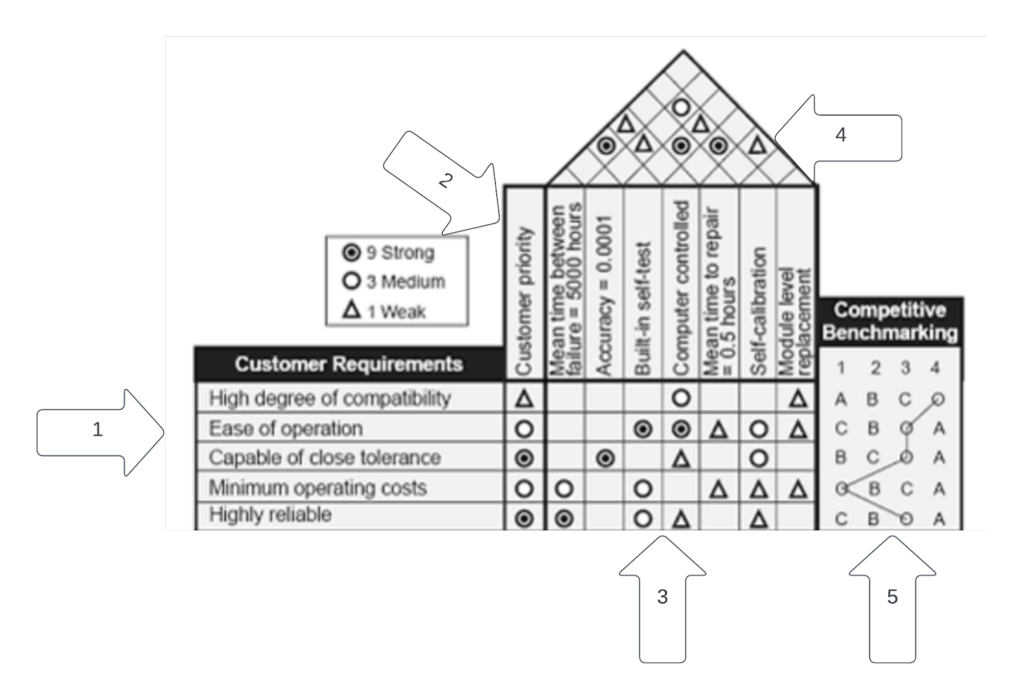
Speaking with customers to improve the quality of their guitars will be necessary. Asking customers what quality means to them is a good first step (e.g. ask what their expectations were). One of the main tools for gathering and using customer feedback, displayed in image 2, is called Quality Function Deployment (QFD) or sometimes known as a House of Quality. This is a structured document to find out what features your customers want and in what priority, who the benchmark of competition is, what measurements are in place, how your business currently scores on the different measurements, and finally the top of the “house” is a display of the interactions in the measurements.
Building a QFD goes in the numbered order displayed with arrows, starting on the left side with customer requirements. Ask customers what their requirements are and to rank their relative importance. The 9/3/1 scale used below is a sample – one could just as easily use a 1-10 scale or anything else to weigh the relative importance of the requirements. (The first column in image 2 is the ranking of importance of requirements.)
Once the customer’s voice has been captured, it’s important to define what operating processes and internal measurements are used. (e.g. accuracy of 0.0001” or built-in self-test below.) Next, it’s important to rank the internal processes to the customer requirements to understand how strongly they are related (box 3).
Box 4 is where the internal processes can be related to one another to see how the whole process fits together. To interpret the relationships, trace up from one internal metric to a complete square, make a 90 degree turn and trace it down to the next metric. The meeting point of those two metrics is where the strength of a relationship is notated.
Lastly, determining what competitors are offering can point your business in the right direction for what a customer’s expectation is. If we’re talking about cell phone cameras, the iPhone might have the best camera, while Samsung has the second best, and Motorola has the third best camera. If you’re Motorola, understanding what camera the iPhone is using will help you understand what needs to change on your end. In the Competitive Benchmarking section, the example company is “O” and the competitors are “A,” “B,” and “C.” Benchmarking shows that company “O” is losing to its competitors in 4 of the 5 areas their customers care about.
The output in this example is that customers care about close tolerance and reliability the most. Both of those areas company O is losing to competitors. To make improvements in reliability, the company should focus on mean time to failure, better computer controls and the self calibration feature.
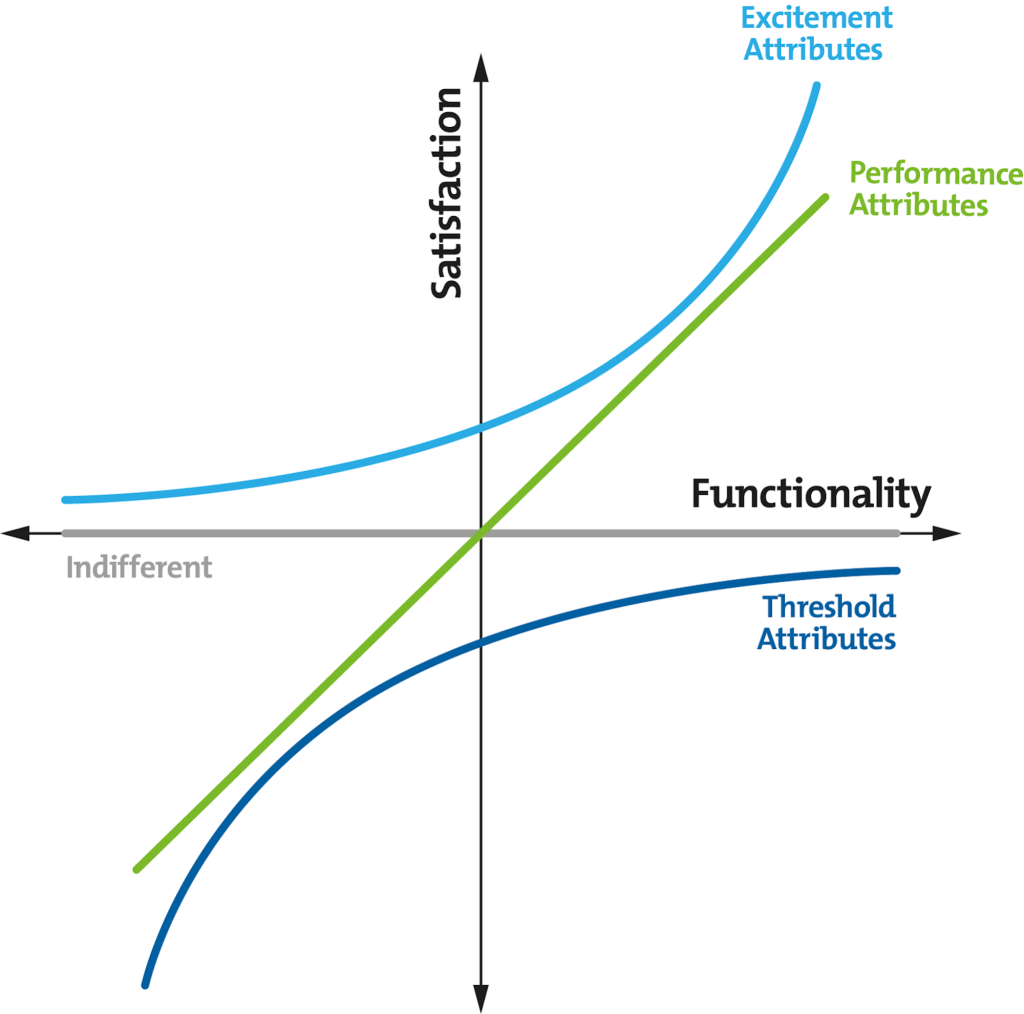
Another tool for thinking about quality is the Kano diagram shown in image 3. A Kano diagram, developed by Dr. Noriaki Kano, is a graphical representation of what basic features of your product or service are required (threshold attributes), which add to quality (performance attributes), and which factors are capable of delighting customers (excitement attributes). As an example, we can look at a cell phone. The threshold attributes required are the ability to make phone calls, send text messages, and have a camera. Without those abilities, no one would purchase the phone. The features that will increase satisfaction are a higher quality camera(s), faster processors, and more storage (performance attributes). The factors that will delight customers could be a 3 day battery life (an uncommon feature, thus it has the ability to excite), being waterproof, and being capable of becoming a wifi hotspot to connect a laptop to. Image 3 below offers a sample of a Kano diagram from MindTools. Putting a Kano diagram together should be done in conjunction with customers. Ask them to explain what features they require, what they like, and what would be a surprise for them. Finally, use the data to drive activities in the day-to-day work.
A third tool for improving the quality of a product or service is to use an Ishikawa, or fishbone, diagram. This is a tool for identifying the root cause of a quality issue. Developed by Kaoru Ishikawa, a fishbone diagram is an exercise for documenting where the source of a defect is. A fishbone diagram creates visibility into the source of error. Once the root cause of an error can be addressed, it can be squashed (or at least minimized). Image 4 below shows a sample. The specific issue that you’re trying to eliminate goes on the right side – in the head of the fish (so to speak). Then, moving to the fish body, primary factors that contribute to the issue are listed. Those factors are then broken down further, until an actionable step is identified. As an example, we can imagine a restaurant. If the defect we’re interested in correcting is undercooked hamburgers, the main factors might be low grill temperature, not enough time on the grill, inexperienced cook, misreading the customer’s request, or accidentally sending the wrong order out. Each of those can be further broken down into actionable steps to make sure burgers are consistently cooked correctly (or insert the defect you’re solving for).

The final quality idea to discuss is quality at the source, paired with individual autonomy. Waiting until a product is finished completely to do an inspection for defects is not only a killer of time, it’s also too late in the process to be thinking about quality (we cannot add quality with an inspection). Individual contributors should be thinking about quality in their work, at each step in the process. If a product moves through four departments before being finished, each department needs to be doing their own quality checks to make sure the product meets standards. If there is an issue, the production should be temporarily stopped, and the root cause of the defect should be found and eliminated. A bad machine, a bad drill, a bad input, or whatever the root cause is needs to be sought out and eliminated to ensure the issue does not arise again. Giving the individual contributors power to pause production, seek out a root cause, and eliminate the source will increase the long term quality of the production line. Let’s look at why –
If ACME is in the business of making futons (couches that unfold into a bed), they will have a few components that need to fit together correctly to ensure the hinge mechanism works properly and consistently. Let’s say there are three main components to the futon frame. There is a left side support, a right side support, and a folding platform in the middle. The left and right side supports are mirror images of each other. The supports need to be a particular size so the folding platform fits between them and can move easily. If, in the middle of production, the person building the left side supports misses the tolerance by building a support too small, the futon will be defective. Simply tossing the bad left side support away is not a solution. The root cause of the issue has not been resolved. In the future, there will be more defective left side supports, and more waste. By going upstream and identifying what caused the issue, it can be eliminated. Maybe a molding jig has worn down from years of abuse. Maybe a drill press has the wrong bit in it. Identifying what the root cause is should be done as quickly as possible, and eliminated as quickly as possible to ensure it never happens again. By allowing the individual contributors to stop the production, identify and eliminate the cause of the issue, the long term advantage is less down time, fewer defects, and more autonomy (as seen in Maslow’s hierarchy). Where in your work are there commonly “defects?”
