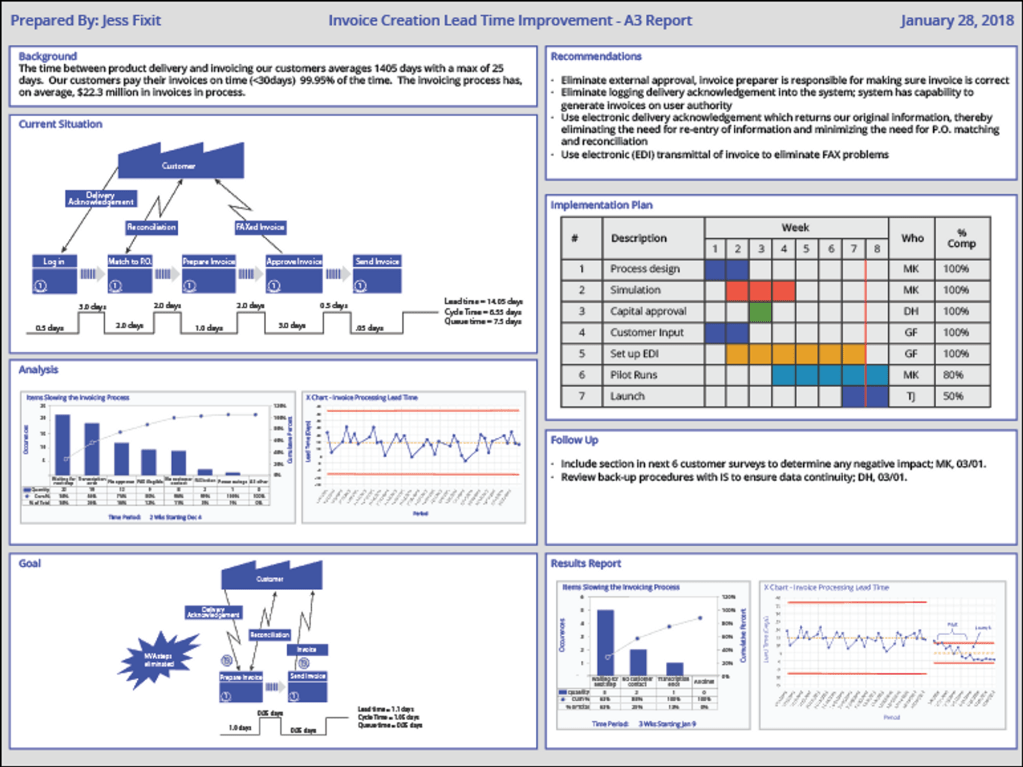
The name A3 is a reference to the size of a piece of paper; one that measures 11” x 17.” Most commonly used during projects involving multiple departments, an A3 report condenses relevant information into a one page, heavily visual document. (Refer to image 1 below for a sample). The purpose of these is not making reporting faster or easier. Instead, the purpose is to ensure rigorous thinking around sharing the most useful information to get alignment and buy in from cross functional teams. Doing these consistently over the life of a project makes them exceptionally valuable for tracking progress. By combining information from different departments onto a single sheet of paper, a meeting can use the report as an agenda, everyone can easily see what is going on and stay engaged, and for external stakeholders (e.g. investors), these reports provide a lot of insight into the progress of the project. They’re typically read from the top left down, then over to the top right and down.
Select use cases: construction projects, quality improvement projects, new product initiatives, product launch planning, marketing campaigns, and acquisition planning. These can be used when the engineering / product team, marketing team, sales team, finance team, HR and any other relevant parties need to meet to work together. When meetings are happening, a visual display of relevant information is much more useful than a text-based agenda.
To make an A3 report, open your favorite word processor or slide creator (Google Slides, PowerPoint or Canva are great for this). Set the dimensions to 11”x 17” (rotated to landscape, so the 17” is on top). The top half inch is dedicated to addressing the report, dating it, titling it and adding the author’s name. The author of these reports should be a project manager that is intimately familiar with all pieces of the project. The left side of the report is for information. Recalls the PDCA framework we have covered before. The plan phase is encapsulated with the information shared on the left side. Relevant background information, the current situation, analysis of the situation, and the ideal future state are noted on the left. It will likely be a challenge to condense all the information – that is the point.
The right side of the report includes the do, check and act sections of Deming’s cycle. Getting from the current situation to the desired future state requires planning and that certain actions be taken. The corresponding recommendations get their own space. An implementation plan or gantt chart depicting progress to date is also included for quick access to progress. The follow-up actions are the tasks required to maintain the new state of things, post implementation. The results report is often left blank when the rest of the report is made, then filled in after the action plan has been completed. Using a different color ink, adding a new date, or other marking system to denote when the info was gathered is helpful.
To run an effective meeting with the A3 report as the guiding document, it can be helpful to imagine it as a panel style interview. In these scenarios, the Project Manager who authored the document is the “host” and the department heads are the “experts” being interviewed. The PM will kick off the meeting with a high level overview of what project is being discussed and what the status of it is. From there, asking the engineering, finance, or other relevant leads to elaborate on their part of the document will be useful. The document is the guardrails that keeps the meeting flowing, and by the end of it, there should be crystal clear next steps for everyone.